Understanding Website Heatmaps takes you on a journey into the world of web design, where colors and patterns reveal the hidden behaviors of online users. Get ready to dive deep into the data and uncover insights that will revolutionize your website optimization strategies.
Understanding Website Heatmaps
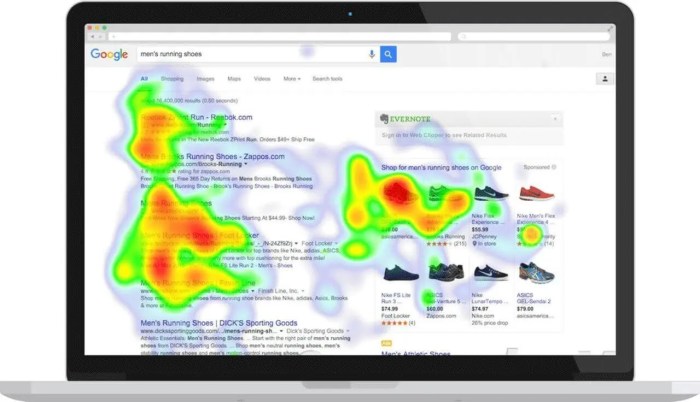
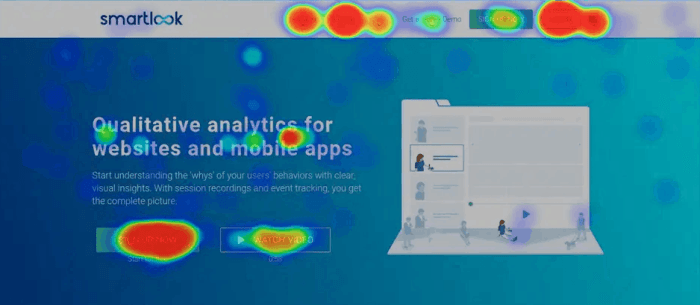
Website heatmaps are graphical representations of data that show where users interact with a webpage. They help designers understand user behavior and make informed decisions to improve user experience.
Types of Website Heatmaps
- Click Heatmaps: Show where users click the most on a webpage, helping identify popular areas and potential areas for improvement.
- Scroll Heatmaps: Display how far users scroll down a page, indicating where content may need adjustments to keep users engaged.
- Move Heatmaps: Illustrate the movement of the cursor on a webpage, providing insights into user attention and engagement.
Benefits of Website Heatmaps
- Identifying User Patterns: Heatmaps reveal common trends in user behavior, allowing designers to optimize layouts based on how users interact with the site.
- Improving UX: By analyzing heatmaps, designers can enhance navigation, content placement, and overall user experience on a website.
- Increasing Conversions: Understanding user behavior through heatmaps can lead to more effective call-to-action placements and ultimately improve conversion rates.
Types of Website Heatmaps

When it comes to analyzing user behavior on a website, different types of heatmaps play a crucial role in providing valuable insights. Click maps, scroll maps, and hover maps are three main types of website heatmaps that offer unique perspectives on how users interact with a site.
Click Maps
Click maps track the areas on a website where users click the most. By visualizing this data, website owners can identify popular elements, such as buttons, links, or images, that attract user attention. For example, a click map can reveal whether users are clicking on a specific call-to-action button or ignoring certain sections of a webpage.
Scroll Maps
Scroll maps show how far down a page users scroll before leaving. This type of heatmap helps website owners understand which parts of a webpage are engaging enough to keep users scrolling and which sections might need improvement. For instance, a scroll map can highlight areas with high drop-off rates, indicating potential content optimization opportunities.
Hover Maps
Hover maps display where users hover their cursors on a webpage without necessarily clicking. This data can indicate areas of interest or confusion for users. For example, a hover map can show if users are exploring product images or struggling to find specific information on a webpage.
Using multiple types of heatmaps is essential for comprehensive data analysis because each type offers distinct insights into user behavior. By combining click maps, scroll maps, and hover maps, website owners can gain a holistic view of how users interact with their site and make informed decisions to enhance the user experience.
Interpreting Heatmap Data

To make sense of heatmap data, it’s crucial to understand how to interpret color gradients and what they signify. The color scale on a heatmap represents the intensity of user interaction on different areas of a webpage. Darker shades usually indicate higher activity, while lighter shades suggest lower engagement.
Color Gradients on Heatmaps
- Red or dark colors typically indicate areas with the most clicks or interactions, showing high user engagement.
- On the other hand, blue or light colors represent areas with minimal activity, indicating low user interest.
- Yellow or orange shades fall somewhere in between, showing moderate user engagement.
Identifying Patterns and Trends
- Clusters of dark colors can reveal hotspots where users are most likely to focus their attention.
- Areas with consistent patterns of interaction, such as scrolling or clicking, may indicate user behavior trends.
- Sharp transitions in color gradients can highlight areas where users are getting stuck or encountering issues.
Translating Data into Actionable Insights, Understanding Website Heatmaps
- Identify areas of high engagement to prioritize content or features that resonate with users.
- Address any usability issues in areas with low interaction to improve user experience and drive conversions.
- Experiment with layout changes or call-to-action placement based on heatmap data to optimize website performance.
Implementing Heatmaps on Websites
Implementing heatmaps on websites involves integrating heatmap tools to collect data, choosing the right tool based on specific needs, and setting up and configuring heatmaps for accurate data collection.
Integrating Heatmap Tools
To integrate heatmap tools on a website for data collection, follow these steps:
- Choose a heatmap tool that best suits your website’s needs and goals.
- Sign up for an account with the chosen heatmap tool provider.
- Install the heatmap tracking code on your website by copying and pasting it into the appropriate section of your website’s HTML code.
- Customize the heatmap settings to track specific user interactions, such as clicks, scrolls, and mouse movements.
- Test the heatmap tool to ensure it is accurately tracking user behavior on your website.
Choosing the Right Heatmap Tool
When selecting a heatmap tool, consider the following factors:
- Features offered by the heatmap tool, such as click heatmaps, scroll heatmaps, and mouse movement tracking.
- Pricing plans and affordability based on your budget and requirements.
- User-friendliness and ease of use for setting up and analyzing heatmap data.
- Compatibility with your website platform or content management system.
- Customer support and resources provided by the heatmap tool provider.
Setting Up and Configuring Heatmaps
To ensure accurate data collection with heatmaps, follow these best practices:
- Define clear goals and objectives for using heatmaps to analyze user behavior on your website.
- Configure heatmap settings to track relevant user interactions and behavior patterns.
- Regularly monitor and analyze heatmap data to identify trends, patterns, and areas for improvement on your website.
- Integrate heatmap data with other analytics tools to gain a comprehensive understanding of user behavior.
- Regularly update and optimize heatmap settings based on new insights and data analysis.
